
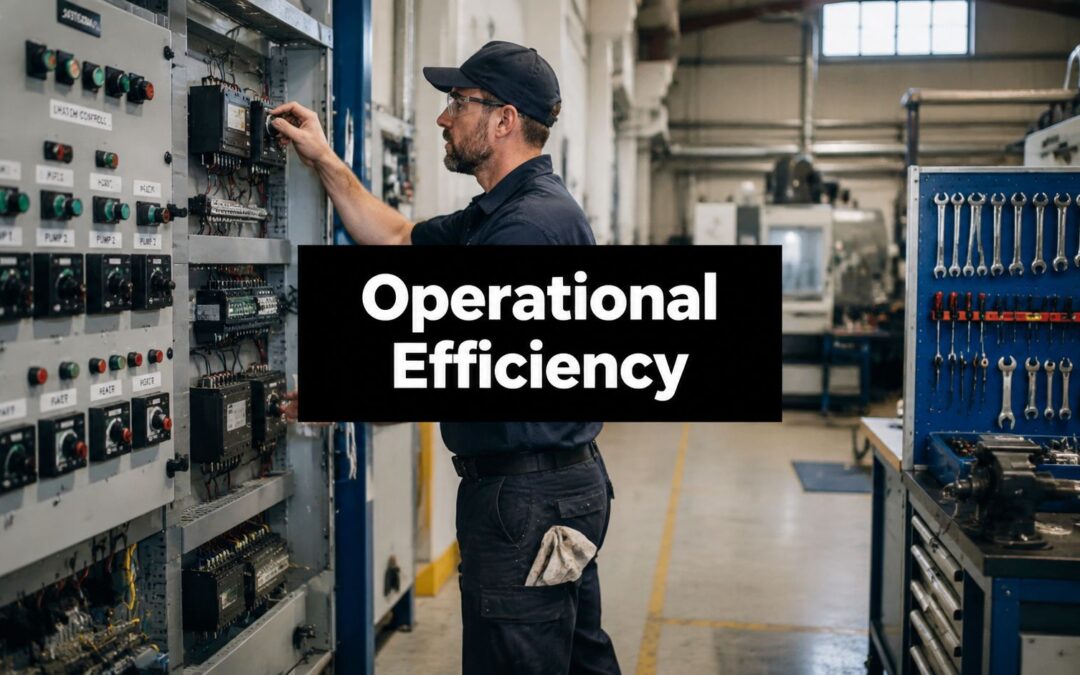
The shift starts with a handover nobody has time to finish. A cable tag is wrong, a safety sign has faded, and the CNC operator is waiting for a drawing before the next job can move. Each issue looks minor in isolation. Together, they create downtime, rework, searching and avoidable waiting that the production plan never allowed for.
That's why learning how to improve operational efficiency starts with measurement and traceability, not with buying another platform. The strongest programmes make losses visible, fix the process that creates them, and give people reliable information at the point of work. In Australian plants, durable labels, asset identification and consistent standard work often matter just as much as larger automation projects.
Why Operational Efficiency Has to Be Designed In Now
A cable re-tag is wrong, an electrician pauses until the circuit is confirmed, and the next job waits. Elsewhere, a faded sign sends a technician looking for the right isolation point. A CNC has capacity on the schedule but remains idle because the drawing is missing. On a shift report, these events may appear as minor delays. Across a week, they consume production time without a clear owner or loss code.
The national picture makes those gaps harder to dismiss. The Productivity Commission reported that multifactor productivity fell by 0.5% in 2024-25, below the 20-year average growth rate of 0.4% per year and below the 1.6% annual average recorded from 1994-95 to 2003-04 (Productivity Commission productivity performance data). The ABS also reported that long-term labour productivity's 20-year average annual growth rate had eased to 0.8% in 2023-24, down from 1.8% in 2003-04.

The recent movement has also been volatile. Labour productivity fell 0.7% in 2024-25, alongside weaker GDP-per-hour performance, according to the Productivity Commission's national productivity reporting. Capital spending can add capability, but it cannot correct a missing drawing, an unreadable label or a handover with no traceable record.
Focus on controllable losses
Start by classifying interruptions that the plant can measure and control:
- Downtime: equipment cannot run, or people cannot safely release it.
- Rework: work is repeated because of defects, wrong identification or incomplete information.
- Waiting: operators, tradespeople or machines sit idle while someone locates an answer.
The practical response is to build controls into the workflow. A durable asset ID from Evright Industrial, a clear panel label, a controlled drawing location and a defined handover each reduce the chance that a small information failure becomes a production delay. Record the interruption, identify the missing control, and make the corrected information available where the work happens. That is how efficiency improves without asking people to work faster.
Diagnose Before You Fix
The first improvement meeting should not begin with a preferred software package. It should begin with a baseline that shows where time, quality and capacity are being lost.
Choose three to five KPIs that reflect the process rather than management preference. A manufacturing line may use OEE, first-pass yield, changeover time, on-time delivery and energy per unit. A facilities team may replace OEE with planned-versus-reactive maintenance, response time and asset search time. Capture two weeks from existing systems before changing the process, then validate the numbers with a floor walk.
Core KPIs and the losses they expose
| KPI | What it measures | Loss category exposed | How to capture it |
|---|---|---|---|
| OEE | Availability, performance and quality together | Downtime, speed and defects | Machine records plus operator verification |
| First-pass yield | Work accepted without correction | Rework and defects | Quality records at the first inspection point |
| Changeover time | Time between the last good part and the next good part | Setup and waiting | Start and finish timestamps |
| On-time delivery | Orders completed by the promised point | Waiting, planning and flow | Production and dispatch records |
| Energy per unit | Energy input for each unit of output | Waste and inefficient support processes | Meter data divided by verified output |
Then run a loss walk. Stand beside the work, follow one job from release to completion, and record every stop, search, correction and handover. Don't rely on memory. Ask the operator what happened, where the information came from and what they had to do when it was wrong.
Practical rule: If the team can't point to the loss on the floor, the KPI isn't ready to drive a change.
Build a one-page diagnostic
Use one sheet with five fields:
- Process and owner: name the area and the person accountable for the result.
- Baseline: record the selected KPI and the observation period.
- Top losses: rank downtime, defects, waiting, changeovers or motion by observed impact.
- Evidence: attach a job card, timestamp, defect sample, photo or maintenance record.
- Next test: define one change, one measure and a review date.
A small fabrication shop might discover that overtime isn't caused by demand alone. If operators stay late to remake parts carrying the wrong WIP identification, the overtime is a symptom of rework and traceability failure. The correct response is to separate the time spent producing new work from the time spent correcting mislabelled work, then test a controlled WIP identification method.
For a broader operational review, MA Hydraulics Ltd optimisation tips offer useful context on evaluating performance before selecting an intervention. The principle applies on a plant floor: define the failure, measure its frequency and test the smallest credible correction.
Lean and 5S Practices That Stick
A 5S programme earns its place during a production shift, when operators can find tools, spot abnormal conditions and return the area to a known state. A team that tidies only before an audit will not remove the search time, misplaced materials or identification errors that create hidden rework.
Run the first pilot in one work area. Sort means red-tagging items that do not belong at the station and moving them to a holding area for a decision. Give the red-tag zone an owner and a removal date. Without both, it becomes another storeroom.
Set in order places tools where the work happens. Shadow boards with cut-outs for changeover tools make a missing item visible at once. The team leader must check the board as part of the routine, or tool shortages soon become accepted conditions.

Make the standard visible
Shine uses cleaning to expose abnormal conditions. A daily wipe-down of Trotec Laser machine optics and the bed can reveal residue, damage or contamination before it affects a job. Cleaning, inspection and repeatable machine settings belong in standard work, rather than in an operator's memory.
Standardise with a laminated, one-page checklist at each station. Add photographs for cleaning checkpoints and show the correct positions for tools, materials and labels. Keep the sheet beside the process so using it does not require a separate search.
Sustain with a short weekly audit led by the team leader. Record each finding, assign the correction and check whether the condition remains fixed. An attendance sheet confirms workshop participation. It cannot confirm that the process improved.
Safety signage connects 5S with worksite control. AS 1319-1994 covers the design and use of occupational safety signs for controlling safety behaviour, warning about hazards and providing emergency information (WorkSafe ACT guidance on safety signage). The recognised categories include Danger, Prohibition, Mandatory, Warning, Emergency or Safe Condition, Fire, and Hazchem or Dangerous Goods (Australian safety sign categories and sizing guidance).
Place each sign where the decision occurs, choose the category that states the required action and match its size to viewing distance. Durable floor marking and labels for movement and identification can support the visual controls used around equipment, walkways and work-in-progress.
Watch the practical 5S method in action before running a pilot:
Maintenance, Asset Labelling and Traceability
A technician arrives at a switchboard during a planned shutdown. The fault is known, but the panel label is missing, the tag cannot be read and the asset register uses another name. Work stops while someone confirms which equipment is in front of them.
That delay is a traceability failure before it becomes a maintenance failure. Planned work should identify the asset, task, method and release condition before the technician starts. Reactive work often begins with an interruption, followed by a search for the correct equipment and record. Durable asset IDs, panel labels and QR-coded equipment tags remove that uncertainty by linking the physical item to its maintenance history.
Make the physical record match the digital one
Use four controls at the point of work:
- Physical asset: the machine, panel, valve, switchboard or medical device.
- Permanent identifier: a legible code that withstands the site environment.
- Digital record: the maintenance, inspection or service history.
- Work instruction: the current isolation, test or repair information.
Laser engraving supports this system when the material and marking method suit the application. Check readability after handling, cleaning, heat, moisture and other exposure relevant to the site. A QR code only helps when the marked surface remains scannable and its linked record stays current.
The production cost of weak identification appears in small interruptions. A Commonwealth Bank manufacturing insights report recorded a current utilisation rate of 84.1% (Commonwealth Bank manufacturing insights report). At that utilisation level, searching for an asset, replacing a tag or checking an inconsistent drawing can disrupt planned work, particularly during shutdowns involving several trades.
Join safety control to asset control
Safety signs and asset labels should work together at the decision point. AS 1319-based signs identify danger, prohibition, mandatory actions, warnings, emergency conditions, fire information and dangerous goods. The equipment label identifies which asset those instructions apply to.
This matters across switchboards, healthcare equipment and distributed essential services. A clear code can support safer isolation, quicker inspection and more reliable records, provided the register, drawing and physical label agree. Evright Industrial's asset tracking best practices offer practical guidance for assigning ownership and keeping those records connected.
Maintenance teams can also review American Additive Manufacturing MRO services for a useful distinction between keeping equipment available and responding after failure. The operating rule is straightforward: label the asset where work occurs, keep the identifier readable and audit the record whenever equipment changes.
Choosing Where Automation Pays Off
A process can look modern and still produce the same hidden losses. Start with the loss record: repeated searching, rework, missed inspections, unclear identification and traceability gaps. Automation earns its place when the team can measure the problem, define the required process and act on the resulting information.
Score each candidate against volume, variability, error cost and data value. High volume with low variability usually suits automation. High variability with limited repetition may still require an experienced operator. High error cost can justify a digital check even when the process volume is modest.
A CMMS-triggered preventive maintenance task is a sensible early step because the trigger, asset and action are clear. A vision system on a high-mix assembly line may be a poor first investment if product variation, lighting and acceptance criteria remain uncontrolled. The system can inspect faster, but it cannot decide what an inconsistent standard means.

Automation fit by volume, variability and error cost
| Process profile | Low-cost fix | Mid-cost upgrade | High-cost platform |
|---|---|---|---|
| Low volume, high variability | Templates, checklists and clear printed signs | Digital work instructions | AI assistance only after data quality is proven |
| High volume, low variability | Standard work and fixed-position tools | Sensors and live dashboards | Automated control or optimisation |
| High error cost | Verification step and durable identification | Barcode or QR scanning | Predictive decision support |
| High data value | Consistent manual capture | Connected equipment metrics | AI optimisation after reliable history exists |
Use a staged cost ladder: manual, digital, IoT, then AI. A point-of-use scan may close a traceability gap without connected machinery. A sensor fits equipment whose condition changes continuously, provided the team can respond to its signal. AI belongs later, after the process generates trustworthy history and a named person owns the recommended decision.
Before submitting a capital request, test a low-cost correction. Replace an ambiguous sign, create a controlled template, standardise a drawing handover or add a verification field. Durable laser-engraved labels and signs can remove repeated inspection and identification work before new software is justified. If the loss remains after the process is clear, the technology case is easier to defend. Manufacturing asset management software suits operations that need structured connections between assets, records and workflows rather than another isolated spreadsheet.
Training, Standards and the 90-Day Improvement Loop
A new standard only works when people can perform it and another person can verify it. Training should combine explanation, hands-on practice and a sign-off test at the actual workstation.
The first two weeks should start with a gemba walk and a skill-gap review. Observe the task, compare the current method with the required standard and record where the operator needs instruction. At a Trotec Laser machine, that may include the approved material, file control, setup checks, cleaning points and label inspection criteria.

Assign the work to named people
Use three roles:
- Process owner: maintains the standard and confirms whether the change works.
- Gemba lead: runs the weekly floor observation and records barriers.
- Sponsor: removes resource conflicts and reviews progress.
During the 90-day loop, hold weekly gemba walks, monthly KPI reviews and keep a visible before-and-after board. The board should show the problem, baseline, action, owner, review date and result. A daily improvement stand-up can remain short, but it must lead to a specific action rather than a list of complaints.
Three breakdowns appear repeatedly:
- Suggestion-box drift: ideas accumulate without tests. Set a decision date and assign each accepted idea to an owner.
- Reporting-only behaviour: the team updates KPIs but doesn't change the process. Require one observed countermeasure for every unresolved loss.
- Champion dependency: the programme stops when its strongest advocate moves roles. Store standards in one controlled binder or system and train a second person to run the cadence.
Continuous improvement survives staff turnover when the method is easier to follow than the old informal practice. The audit trail, visual standard and named ownership matter more than a polished launch event.
Putting It Together and What to Do This Week
An operations or facilities manager can start with three commitments this week:
- Measure one loss category: choose downtime, rework or waiting and capture it at one work area.
- Run one 5S pilot: select a station, red-tag what doesn't belong, fix tool locations and audit the result.
- Check five critical assets: verify that each identifier is legible, durable, correctly recorded and connected to the required drawing or maintenance record.
This approach keeps the first move manageable. It also prevents a broad efficiency programme from becoming a collection of workshops with no proof that the work improved.
For another practical perspective on prioritising process losses, the Haulier.AI efficiency guide provides useful ideas that can be adapted beyond transport operations. In an Australian industrial setting, the same logic points back to physical control: a durable label, a compliant sign and a reliable asset record can remove hidden searching, rework and inspection delays.
Evright Industrial, the specialised laser-engraving division of evright.com, supports these workflows with durable laser-marked asset tags, equipment panels, QR-coded traceability solutions and AS 1319-aligned safety signage produced on Trotec Laser machines. The evright.com site explains how its labelling and signage work can fit into a broader operational efficiency programme.
Evright Industrial can help you specify durable asset labels, equipment identification, QR-coded tags and workplace signage for manufacturing, electrical, healthcare and essential service environments. Visit Evright Industrial to discuss the assets, materials and traceability requirements behind your next efficiency improvement.
Recent Comments