


A Monday production meeting reports 92% schedule attainment. By Wednesday, customer service is handling late-order complaints, maintenance can't identify which CNC lost output, and the production manager is comparing three spreadsheets that disagree. The factory is collecting data, but it isn't tracking production in a way anyone can trust.
That distinction matters. Production tracking isn't a dashboard project. It's a controlled measurement system that connects a defined production unit, a known process route, a disciplined shop-floor event, and a physical asset to one reliable record. The software comes later.
The Factory Floor Problem You Are Probably Already In
The usual failure starts innocently. A shift manager records completed units from a paper traveller, a team leader updates the ERP before going home, and a supervisor adjusts the schedule report to account for a batch that was technically complete but still waiting for inspection. Everyone has entered something. Nobody can explain precisely what happened at each machine.
By Wednesday, the figures have drifted further. A reworked batch has been counted as new output, a split order has been recorded against the wrong work centre, and two identical presses appear in the log under the same informal name. Maintenance knows that “Press 2” stopped, but nobody can prove which physical press that label describes or whether the stoppage affected the job that missed dispatch.
This is why a strong Monday report can coexist with late orders. The problem is usually measurement integrity, not software quality. If operators backfill entries at shift end, the timestamp describes the memory of an event rather than the event itself. If paper travellers disappear between operations, the system loses the connection between material, work order, operator and asset.
Operational rule: If a manager can't trace a lost unit to a line, machine, operation, shift and reason code, the factory isn't tracking production. It's collecting anecdotes in digital form.
The Australian Bureau of Statistics defines labour productivity as gross value added produced per unit of labour input, not units counted in isolation. For manufacturing, the ABS reported average annual labour-productivity growth of -1.0% over the three years to June 2025, compared with a 20-year average of 0.3%. Those figures show why managers need to understand the resources behind output, including labour, equipment availability, time, scrap and rework, rather than celebrating volume alone. The ABS primer on labour productivity provides the underlying definition and context.
The practical fix has four parts: define the production unit, capture events at the point of work, publish KPIs that drive decisions, and give every important asset a durable identity. A useful overview of the wider planning context is this digital transformation roadmap for manufacturers, but don't start by buying another platform. Start by making the physical and operational records agree. The same discipline supports improving operational efficiency on the factory floor.
Build a Tracking Foundation Before You Touch Any Software
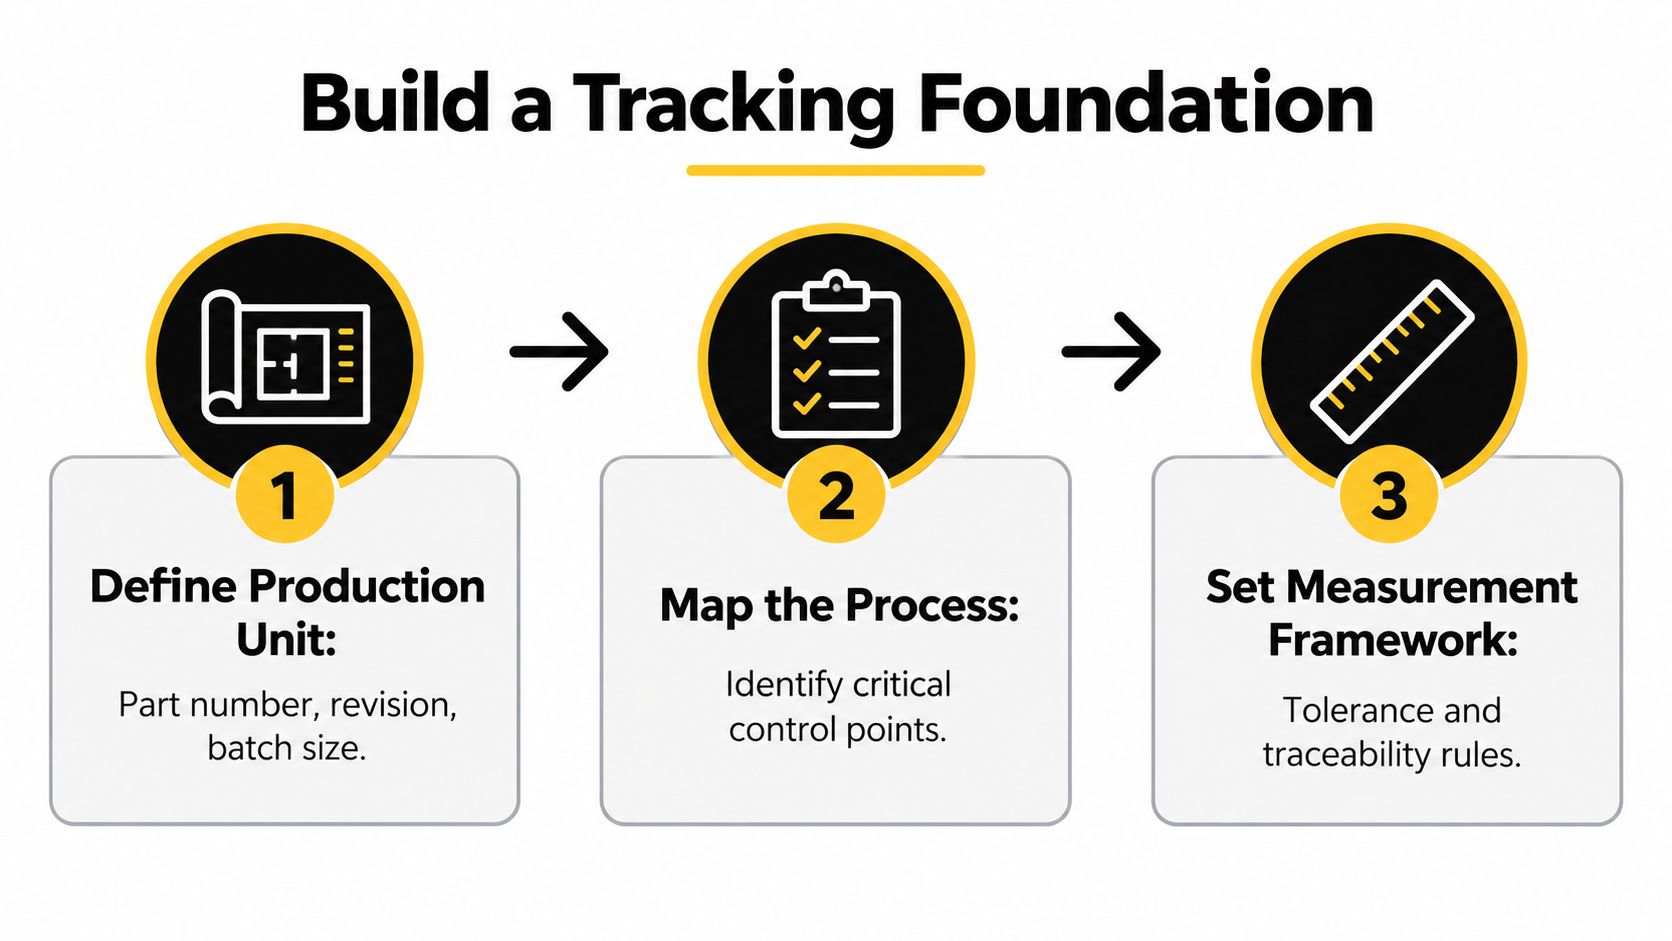
Production tracking starts with a controlled measurement process. Set the rules before selecting software, and make sure they still work during a busy shift, a split batch, an operator changeover or machine downtime.
Define what counts as production
Write the production definition before anyone enters data. For every production unit, specify:
- Part identity: Record the part number, revision, customer or product family, plus any relevant material lot or serial relationship.
- Completion state: State whether the unit is finished, transferred to the next operation, awaiting inspection, rejected, scrapped or held.
- Batch logic: Define how split batches, partial quantities and merged orders are recorded.
- Ownership: Name the person who records the event and the person who approves an exception.
A pressed component is not automatically finished when the machine completes its cycle. It may still require inspection, deburring, assembly or a controlled transfer. Without defined states, one team reports production at the press while another reports it only after inspection. The dashboard then compares different events under the same label.
Lock the route and work-centre identity
Map each operation in sequence. Use ANZSIC codes where they support reporting, then assign a plant-level work-centre ID, operation sequence, expected cycle time, quality gate and material relationship. The routing must show which machine or cell can perform the work and what evidence is required before the job moves on.
Two presses may run the same part code while using different tooling, cycle times or allowable material thickness. Recording both as one line hides the constraint and turns the faster press into a misleading plant average. Fix the routing first. Then choose whether barcode scanning, machine integration or manual entry earns its place.
Control revisions as well. A changed process route must create a traceable version instead of replacing the previous one without a record. Otherwise, the factory compares output made to different standards and labels the difference a productivity gain.
Reconcile before closing the order
At shift end, reconcile shop-floor quantities with inventory movements and dispatch records. Investigate variances before closing the order, with explicit rules for:
- Good output: Units that meet the stated completion condition.
- Scrap: Material removed from the order and recorded with a reason.
- Rework: Units that remain linked to the original order and are not counted as fresh output.
- Work in progress: Quantity and location for anything waiting between operations.
- Handover: Open quantities, held material, downtime and responsibility passed to the next shift.
Use one time source across devices. At each operation, capture machine start and stop events, good quantity, scrap, rework, downtime reason, operator or crew and timestamp. A practical supervisor control is to review any reconciliation variance above 1% against the ERP quantity, a tolerance many plants set for high-volume lines. Tighten it to 0.5% where a single scrapped batch can change the delivery date. Treat the threshold as a plant control, not an industry law, and adjust it to the line's volume and risk.
The ABS manufacturing output index data can provide an external plausibility check, but it is not a substitute for shop-floor records. The control system must identify missing quantities, unexplained scrap and assets without usable identity data before the order is closed.
Use an asset tagging template to standardise physical identity fields before configuring screens. A dashboard built on undefined units and loose routings may look polished, but it will drift from the factory's actual work.
The Core Production KPIs That Drive Decisions
A factory does not need every metric its software can calculate. It needs a short operating set that gives a named manager a clear next action. Start with schedule attainment, throughput per labour hour, first-pass yield, OEE losses and WIP age. Each measure must connect to a decision, an owner and a defined response on the floor.
Read the loss, not just the score
Schedule attainment compares planned output with actual conforming output for a defined period. It shows whether production delivered against the plan. Review the plan history alongside the result, because a revised schedule can make a missed commitment appear successful. Keep rework separate from completed conforming output, or the metric will reward recovery work as if it were first-time production.
Throughput per labour hour links conforming units or standard hours to paid production labour hours. It exposes poor labour allocation, excessive waiting and uneven cycle times that a unit count can hide. Use it with material, energy and capital measures. Labour productivity can improve while total resource consumption worsens.
First-pass yield measures the share of output that passes without rework or repair. Check it when a line appears fast while customer complaints, internal holds or inspection failures rise. Define the measure across the full process. Excluding difficult units or shifting defects to a later operation creates a clean number and a dirty process.
Overall equipment effectiveness is a loss diagnostic, not a trophy for the daily board. Separate availability, performance and quality, then rank the losses by asset and shift. The record needs planned time, unplanned stoppage, actual cycle performance, good quantity, scrap and rework. A strong OEE result can coexist with ageing WIP when the constraint sits at another operation.
WIP age shows how long material has been waiting in the system. It brings queues, missing materials, inspection delays and blocked downstream work into view. Track the oldest jobs, not only the average. A healthy throughput result means little if older orders are becoming less useful to the customer.
Use the ABS manufacturing output reference cited earlier as an external plausibility check, not as a daily plant target. Build the working baseline from your own line-level results, separated by product family and shift. That baseline gives supervisors a defensible view of normal performance and makes abnormal loss easier to investigate.
| KPI | What it tells you | Common misread | First place to look when it slips |
|---|---|---|---|
| Schedule attainment | Whether conforming output matched the plan | Treating a changed plan as an achieved plan | Order status, missed operations and shift handover |
| Throughput per labour hour | How output relates to paid production labour | Ignoring material, energy or capital inputs | Labour allocation, waiting time and cycle-time variation |
| First-pass yield | Whether units passed without rework | Counting repaired units as first-time output | Defect code, operation and inspection record |
| OEE losses | Whether availability, performance or quality is consuming capacity | Using OEE as a universal target | The largest coded loss by bottleneck asset |
| WIP age | Where work is waiting and becoming late | Treating total WIP as a flow measure | Oldest job, blocked route and material status |
Managers formalising this system can review KPI monitoring for data teams, then reduce the framework to measures a supervisor can act on during the shift. A dashboard that shows five scores without the underlying loss, owner and response is decoration. The production meeting should finish with a named action, not another chart.
Choosing the Right Way to Capture Data on the Line
A factory rarely needs one capture technology across every work centre. Paper is useful as a controlled outage fallback, but it becomes costly when staff must reconcile handwriting and late entries. IoT monitoring can improve visibility on a bottleneck asset, while adding little value to a low-volume station where a person still has to confirm quality.
Choose the method by the production risk, not by what looks impressive in a software demonstration.
| Capture Method | Cost per Data Point | Accuracy in Harsh Conditions | Operator Friction | Best Use Case |
|---|---|---|---|---|
| Paper logs | Low to start, higher to reconcile | Variable, depending on handwriting, storage and timing | Low during capture, high during transcription | Contingency capture and simple, low-frequency checks |
| Barcode scans | Low to moderate | Strong when labels are legible and protected | Low when scanners sit at the work centre | Job, batch, asset and operation confirmation |
| RFID tags | Moderate | Useful where line-of-sight scanning is difficult, subject to materials and placement | Low after readers are configured | Reusable containers, movement points and selected asset classes |
| IoT sensors | Moderate to high | Strong for suitable environmental and machine signals, weaker when sensors are neglected | Low for operators, higher for technical teams | Runtime, temperature, vibration and bottleneck monitoring |
| Direct machine integration through OPC UA or MTConnect | Moderate to high | High for available machine states and values, dependent on interface quality | Very low for operators | CNC events, cycle data and machine-state capture |
Manual logs become unreliable when operators must remember several events and enter them later. Use barcode scanning as the default starting point for work orders, assets and quality gates. It creates an intentional confirmation at the point of action and gives supervisors a clearer audit trail.
RFID reduces line-of-sight requirements, but the technology must earn its place. Use it where tags, readers and movement patterns solve a defined problem. Do not install RFID because it sounds advanced or because a dashboard vendor recommends it.
Machine integration provides strong event capture when the signal has a defined operational response. A machine can report running, idle or faulted, but that status will not explain a tool change, missing material or a supervisor-held job awaiting inspection. Those causes still need a human workflow and controlled reason codes.
Match the method to the risk
Use barcode at the work centre when the main risk is assigning the wrong job, asset or operation. Put sensors on a bottleneck when the risk is missed runtime or recurring equipment loss. Connect machine data where available states or cycle values directly support a decision, such as maintenance intervention or a production response.
Keep a controlled paper or offline fallback for network outages. Require every fallback record to be entered and reconciled when the system returns. Otherwise, the outage creates a permanent gap in the production history.
Australian WHS obligations also affect screen placement and operator movement. Do not make a worker use a tablet beside moving equipment when a scanner, foot control, fixed station or later confirmation can record the same event more safely. The capture method must fit the task, the equipment and the operator's normal movement.
For reusable equipment and movement-heavy operations, RFID asset tracking can sit alongside barcode identification. Base the decision on the asset, production volume, environment and consequence of a missed event. A system that slows the job will be bypassed, regardless of how polished its dashboard appears.
Why Asset Identification Is the Hidden Backbone of Tracking
Most failed tracking rollouts have the same physical weakness. The factory has a digital asset register, but the machine, fixture, inspection point or electrical item on the floor doesn't carry a stable identity that a worker can read or scan.
That contaminates every downstream measure. If an operator selects “CNC 3” from a list without confirming the physical machine, downtime lands on the wrong asset. If a fixture moves cells and nobody updates the record, cycle-time comparisons become unreliable. If a similar-looking panel or component has no permanent serial relationship, inspection and production history separate.
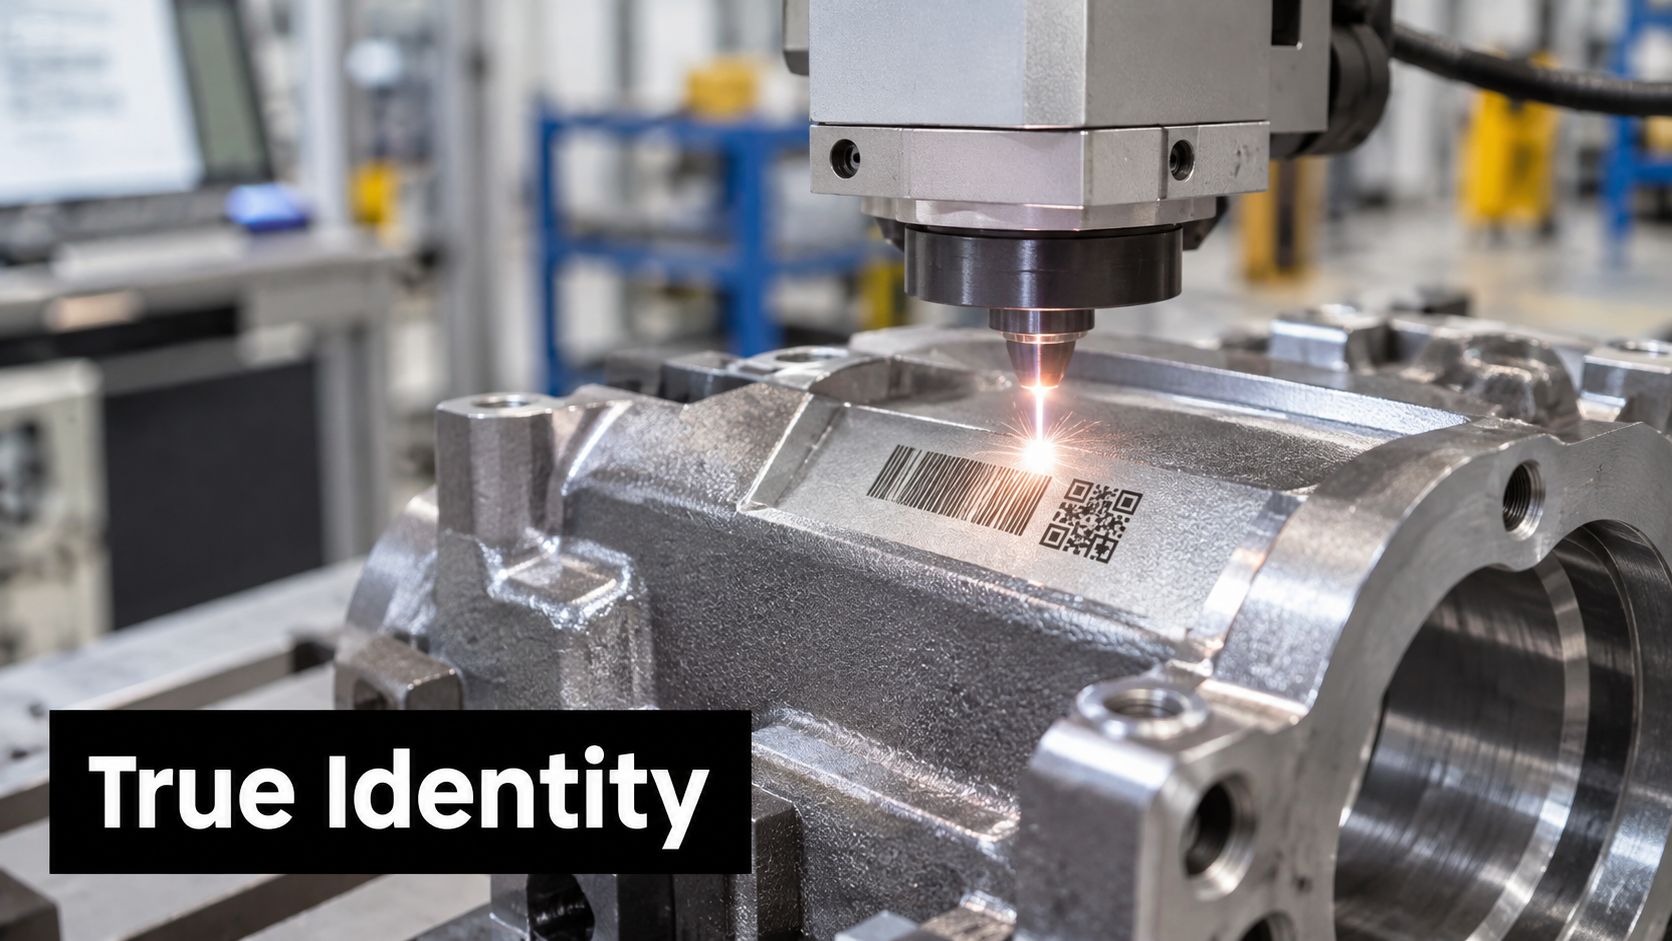
A durable identifier should carry only what the worker needs to establish identity and retrieve the record. That may include an asset ID, serial number, QR code or Data Matrix code, calibration date, inspection reference or hazard information. Put it where a person can see it during the normal task, where a scanner can reach it, and where cleaning, oil, abrasion and foot traffic won't remove the relationship.
Trotec Laser machinery is a suitable production reference for precise engraved labels and signs. Trotec Laser machine imagery belongs in this context because the point is controlled marking on industrial materials, not generic mechanical equipment photography.
Link the physical mark to the master record
The identifier must be unique in the ERP or MES. Scan the asset, retrieve the master record, confirm the location and then attach production, maintenance, inspection or fault events to that identity. Don't use an informal nickname as the primary key.
Australia's model WHS Regulations make signage part of operational control. A person conducting a business or undertaking must display a safety sign where it warns of a particular hazard associated with hazardous chemicals or states responsibilities relating to that hazard. Construction-project contact signs must include the principal contractor's name and telephone numbers, including an after-hours number. The model WHS Regulations set out those requirements.
The same principle applies to confined spaces. Signs must identify the confined space, be erected immediately before work begins and remain in place during preparation, work and completion. Safety signs must be next to the hazard and clearly visible to someone approaching it. The model WHS Regulations version covering confined spaces supports treating label presence, placement, visibility and inspection as trackable controls.
A permanent engraved label doesn't replace a digital system. It gives the digital system a dependable physical entry point. That matters when assets change location, ownership or maintenance status, because the identity stays attached to the thing being measured.
Connecting the Workflow From Operator to Dashboard
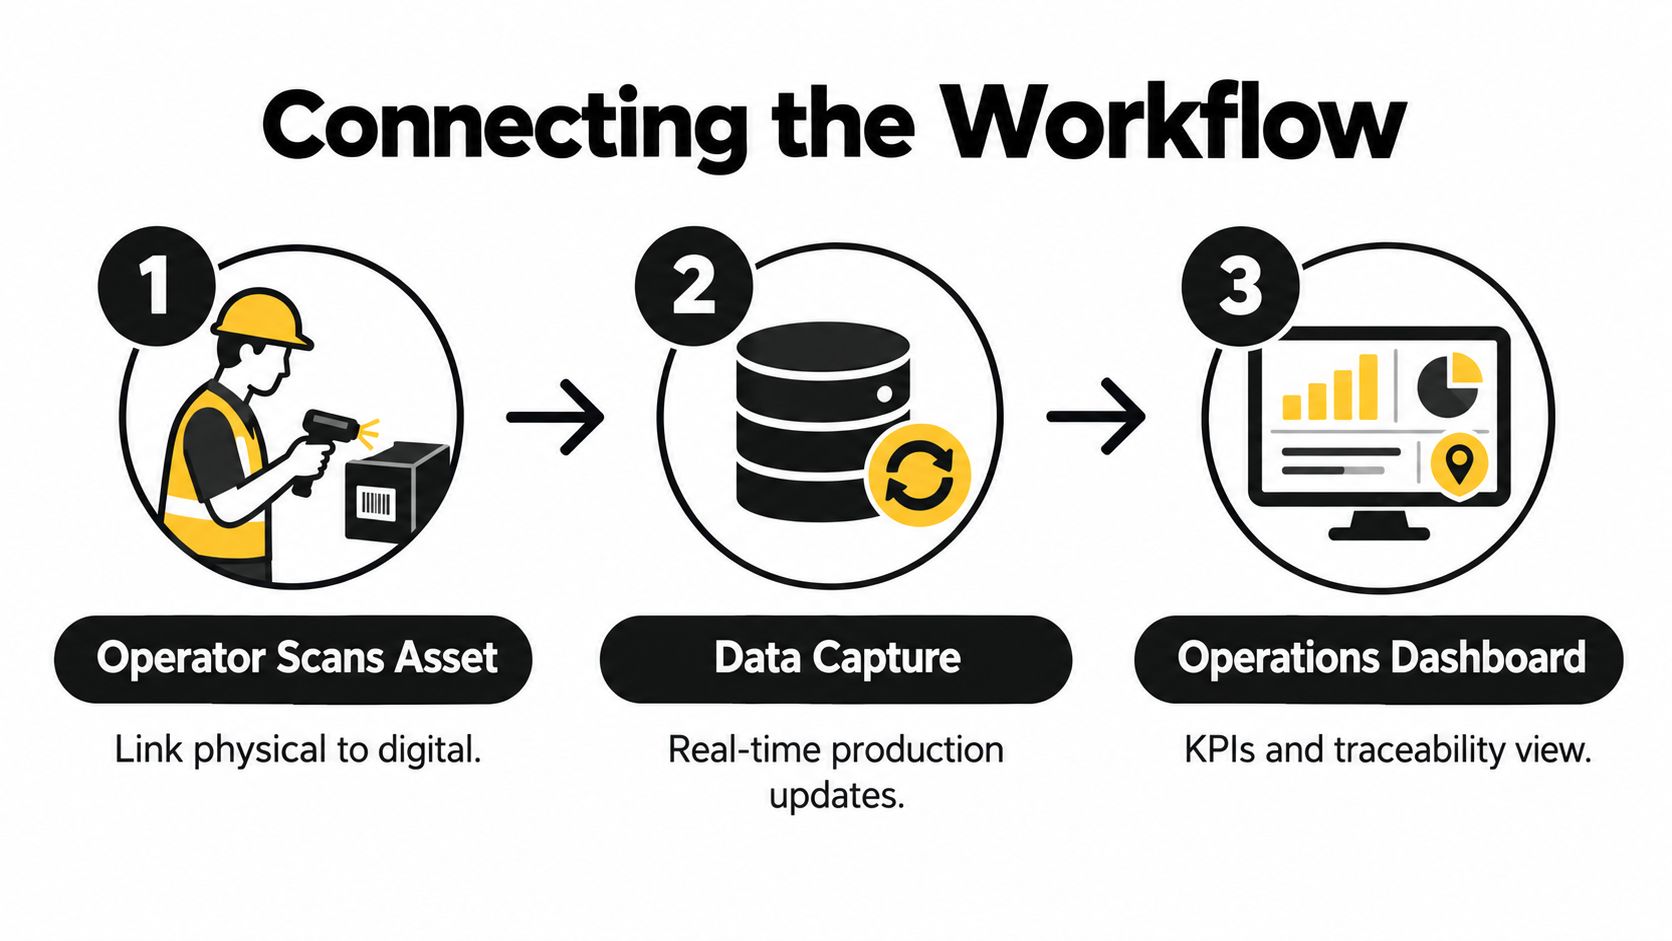
A trustworthy production event should be easy to describe to a new operator. The person, physical asset, job and quantity must meet in one controlled sequence.
Start with the physical confirmation
The operator scans the engraved asset identifier on the machine or work centre. The system confirms the asset master record, location, approved operation and any required inspection or calibration status.
The operator then scans the job traveller, batch or serial relationship. The system checks that the job is routed to that work centre and that the revision is valid. This prevents a worker from recording a valid quantity against the wrong machine or an obsolete route.
Capture the event at the point of action
The operator records good units, scrap, rework, downtime reason and completion timestamp. The interface should show a short list of specific reason codes, with a comment or evidence requirement for unusual events. “Other” should never become the default escape route.
The MES receives the event and passes the controlled production status to the ERP. Inventory movements follow the same quantity logic. If the network fails, the operator uses the approved offline or paper fallback, and the supervisor reconciles those entries before the order closes.
The review layer should show exceptions, not force a manager to interpret every normal event. A supervisor needs to see the largest availability loss, jobs beyond their expected route time, unreconciled quantities, missing asset identification and WIP that has aged beyond the agreed operating limit.
Keep the minimum record intact
At each operation, retain:
- Identity: Asset, work order, part number, revision, material lot or serial relationship.
- People: Operator or crew and approving supervisor where an exception exists.
- Time: A synchronised start, stop, completion or hold timestamp.
- Quantity: Good units, scrap, rework, transferred quantity and open balance.
- Reason: Specific downtime, defect, hold or material-shortage code.
- Evidence: Inspection result, comment, image or linked maintenance record where required.
- Handover: The next operation, location and person responsible for unresolved work.
The ABS methodology for Australian Industry uses defined survey and administrative sources, including Economic Activity Survey and Business Activity Statement data supplied by the Australian Taxation Office. The ABS Australian Industry methodology illustrates the same principle: structured fields and traceable source information produce more defensible measurements than informal claims.
Where Tracking Systems Break and How to Fix Them
A production record can look complete and still be wrong. The common failure is delayed entry: operators finish the work, move to the next job, then batch-log units and downtime at shift end. The sequence is lost, and the reason for an interruption is often gone with it.
Capture the event at the point of action. Put the scanner or input station beside the work. Keep event choices short and require a reason when the event affects schedule attainment, yield, downtime or material balance. If the interface takes longer than the task allows, redesign it. Blaming the operator will not repair a poor workflow.
The next failure is ownerless exception handling. A missed scan, held job or reworked batch enters a shared spreadsheet because nobody owns the category. By the next review, someone may have corrected the quantity, but the cause has disappeared.
Assign one owner to each exception family. Maintenance owns equipment faults. Quality owns non-conformance and rework disposition. Production owns schedule and labour losses. Stores or planning owns material shortages. Plant structures differ, but ownership must be explicit.
Make the review change the work
A weekly review should produce action, not a tour of dashboard screens. Use a fixed agenda:
- Top three losses: Select the largest coded losses by impact on output, quality or delivery.
- One owner: Name the person responsible for the corrective action.
- One due date: Record when the action will be tested or closed.
- One evidence check: Confirm that the data supports the proposed cause.
- One follow-up: Verify that the action changed the loss, rather than simply confirming meeting attendance.
Australian manufacturers face an operating environment that makes short-cycle control important. Manufacturing output contracted by 2.3% in the December 2024 quarter and by 1.7% over the year to December 2024, reducing manufacturing's contribution to quarterly GDP growth by 0.1 percentage points, according to the ABS national accounts release. These figures do not set a target for an individual plant. They do reinforce the need to see short-period output, WIP, downtime and line-specific changes before the next dispatch problem.
Workforce capability affects the result as well. The 2025–26 National Skills Plan states that around 87% of Australian jobs require digital skills, while the Manufacturing Industry Skills Alliance identifies advanced technology and a responsive skills system as transformation priorities. The National Skills Plan update supports a practical approach: train by role, keep interfaces simple and audit data quality every week.
Use short operator training, visual work instructions and a clear fallback procedure. Supervisors should verify automated data instead of trusting it without checks. Do not reward output alone. That encourages hidden downtime, rework and safety-related pauses. Measure honest exception reporting alongside production results.
Better tracking is measured by the response it enables. A supervisor should be able to identify the loss, find the responsible asset, assign an owner and act before the next dispatch problem.
Evright Industrial provides engraved asset labels, equipment identification plates, barcodes, QR codes and Data Matrix marking. These can connect physical equipment with production, inspection and maintenance records. Visit Evright Industrial to discuss labelling for machines, work centres and Australian operating conditions.
Recent Comments